In the previous blog we discussed managing portfolios of opportunities the right way, the Total Value way. In this blog we’re going discuss how the concept of Total Value helps us ensure that we are properly renewing our business, thereby ensuring its long-term sustainability.
Recall the total value formula: Total Value = Direct Value + Learning Value.
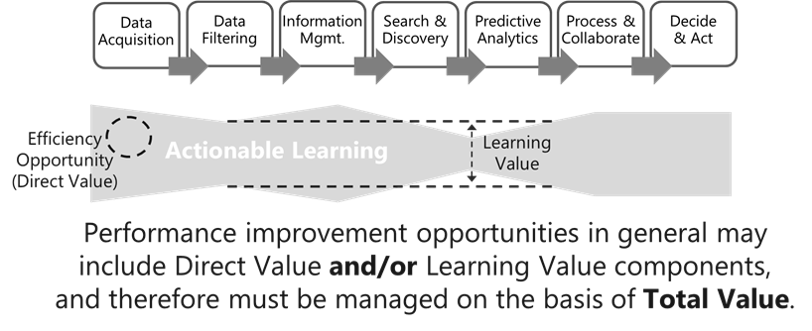
If a decision changes from what it would otherwise be, the resulting value falls in the Learning Value category; if a decision remains the same as before but is performed, e.g., more efficiently, that value is allocated to the Direct Value category. We illustrated that distinction with our standard data-to-learning-to-action process diagram as follows:
Furthermore, some projects and activities, either intentionally or as a by-product, deliver learning value by potentially changing future decisions, and decisions that are not just of the same type as the decision that we are currently considering (for recurring decisions that are of the same type, we should already be taking the value of their improvement into account in the learning value depicted in the above diagram since the resolution of the limiting constraint would benefit the recurring decisions as well).
For projects and activities that are intentionally designed to primarily provide learning value, we typically term such projects and activities experiments, R&D, proofs of concept, pilots, etc. As an example, a decision to conduct an experiment on a particular material may generate a result that influences a different future decision, e.g., a decision on using the material in a commercial product. But it can also be the case that learning value is delivered as a result of decisions that are not primarily intended to generate learning that will influence future decisions. That is the case for many operational decisions which are meant to result in operational-based value, but that also generate collateral learning that enable further refinement of the operations (i.e., improving different future decisions). We often label such collateral learning “experience curve” effects.
So, we have learning value associated with the direct improvement of decisions and we have learning value associated with the results of decisions that affect future decisions of a different type. We can summarize these different components of Total Value with the following diagram.
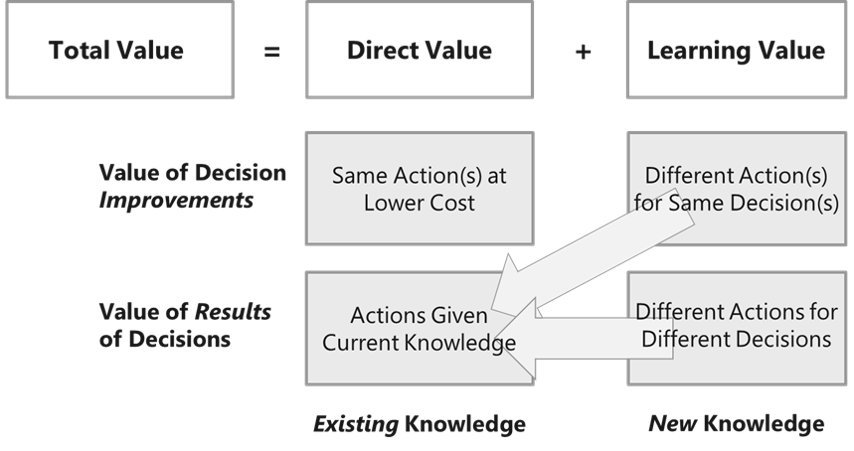
In the diagram we view Total Value from the combined perspective of decisions and knowledge, resulting in four categories of value. And these four categories of value are collectively exhaustive—they encompass all value that is generated by a business. We’ll discuss each of these four value categories in clockwise order.
We start with improving decisions by using existing knowledge, which is the “Same Action(s) at Lower Cost” value category. This corresponds to the efficiency opportunity illustrated in the first diagram. The same action is being taken as before; it is just being done more efficiently.
Now, for that same decision, if we change the resulting action because of new knowledge (i.e., the result of actionable learning), that is the “Different Action(s) for Same Decision(s)” value category. And that corresponds to the learning value opportunity of resolving a limiting constraint in the data-to-learning-to-action process that is highlighted in the first diagram.
The other lens we want to apply with respect to decisions, in addition to improving their efficiency or effectiveness, is with respect to the results of decisions. As mentioned above, the results of some decisions are that they influence future decisions that are of a different type than the current decision. In other words, the actions of these different types of decisions may potentially be different than they otherwise would be, which yields the “Different Actions for Different Decisions” value category. Again, often this category of learning value is the result of decisions related to activities such as experimentation and R&D, but it can also be a by-product of decisions that are not primarily intended to achieve new knowledge that affects the actions of future, different decisions.
That leaves us with the final value category, “Actions Given Current Knowledge.” This is typically the largest category of value for an organization, but it is ultimately derivative from the two learning value categories as shown by the arrows. That is, the new knowledge that is a result of actionable learning becomes the current knowledge for subsequent decisions, or as I put it in the book, learning value is ultimately converted to direct value over time. That’s why in previous blogs I have emphasized that all value that is generated by an organization is ultimately learning value. (Even increased efficiency of performing the same action requires a different subordinate decision/action, so it truly is learning “all the way down.” But creating a distinction between direct value and learning value can be beneficial from a strategic portfolio management standpoint as we will see.)
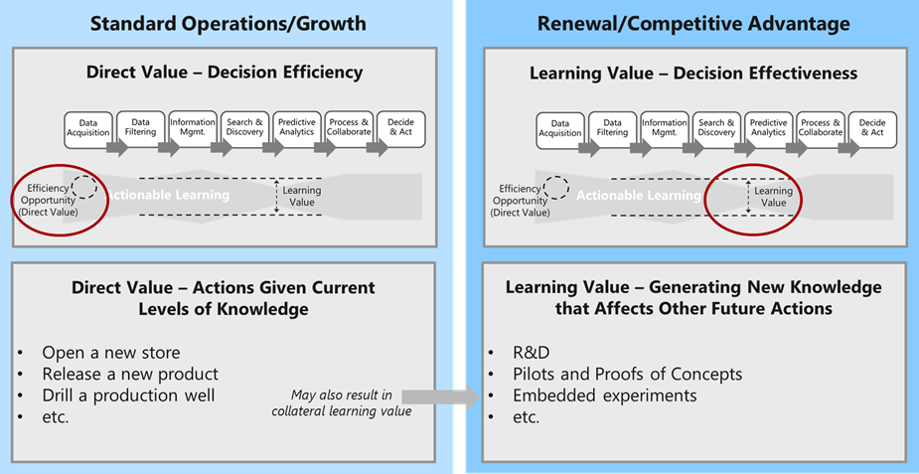
As shown in the following diagram, from a strategic standpoint, direct value relates to the standard operations and growth of a business, while learning value relates to renewing and sustaining the business, which derives from continuously creating competitive advantages. Certainly, efficiency must always be an important focus, but competitive advantage ultimately comes from more effective decision making, and that rests on a foundation of more effective learning.
It can be illuminating to view an organization’s portfolio of projects and activities within the context of the direct value and the learning value that each of the projects and activities is expected to generate (and for projects that are primarily directed toward generating learning, as I do here, it is often helpful to allocate the costs associated with the projects to the direct value category, thereby constituting negative direct value). And by doing so, we can put the portfolio of projects and activities within the perspective of the organization’s overall business renewal lifecycle as depicted in the next diagram.
The business renewal lifecycle for specific business areas begins with R&D-based activities and progresses to pilots and proofs of concept. As learning value is generated along the renewal lifecycle, it is converted to direct value as we discussed above, culminating with completely routine activities in which little to no learning value is being generated (and which are therefore typically ripe for automation).
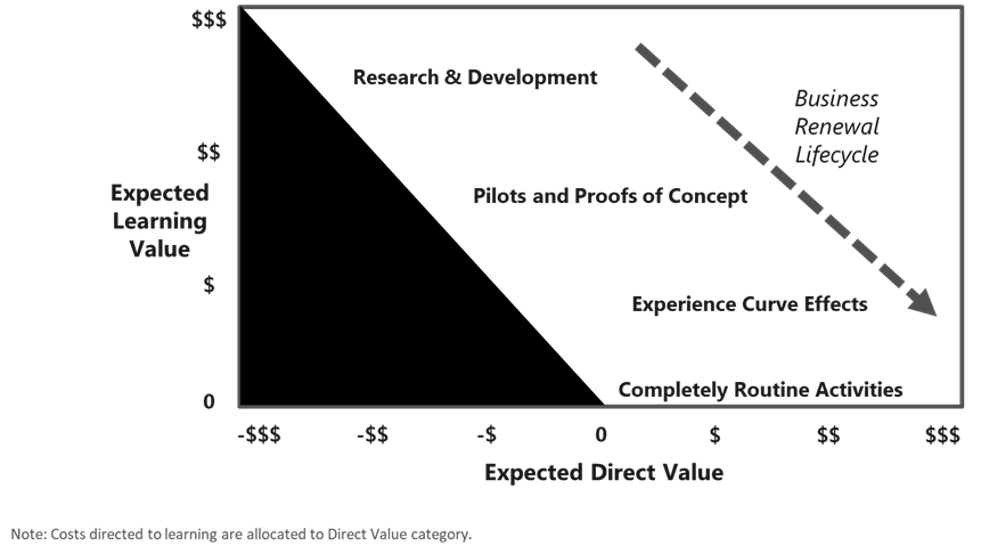
Plotting projects within the framework of the business renewal lifecycle diagram provides guidance on individual projects as well as the overall project portfolio. Of course, projects within the black triangle have a negative expected total value and therefore should be stopped or restructured, and some projects with positive but very small expected total value may be considered distractions and may also be candidates for stopping or managing differently.
Other areas of the diagram also suggest different management actions. For example, for projects with significant expected learning value but also significant costs (negative direct value) carefully stage gating the project can be especially important. High total value projects may deserve to be accelerated. And, for example, projects that are still within an R&D organization and are delivering some expected learning value, but are mostly delivering direct value, may be candidates to move to fully operational units.
Of strategic importance is the overall pattern of projects along the renewal lifecycle, as illustrated in the following example renewal lifecycle chart. For example, are there a dearth of early stage or later stage projects? Are there gaps in the renewal lifecycle? These types of issues are often not obvious without explicitly viewing the direct and learning value of the projects in the portfolio, and without corrective action can have a negative effect on the long-term health of the organization.

In this last diagram we are primarily focused on the learning generated by the projects (i.e., the results of decisions), but we can also include efficiency and effectiveness improvements to decisions and plot them as well. Examining those resulting patterns can also be illuminating. For example, if there is a very high ratio of direct value (cost reductions) versus learning value (improved decisions), that may provide an early warning of potential competitive and sustainability issues.
So, the Total Value way is not only the only way to properly prioritize, it is also the only way that provides the insights that are required to strategically manage the business for sustainability!
Leave A Comment